

 View Exhibition Checklist
Women have made significant contributions to the mapping of the social and physical worlds in the twentieth and twenty-first century. From the artistic creations of Paula Scher and Ruth Taylor [White] to the practical mapping of cities by Phyllis Pearsall and Toy Lasker, we see women playing a vital role in every aspect of modern cartography. Women have also pursued scientific analyses of the world through the medium of thematic maps. The innovative and insightful work of Agnes Sinclair Holbrook and Chicago’s Hull House, of Barbara Petchenik and Joni Seager, and of Marie Tharp have prefigured the thematic mapping and geovisualization enabled by modern digital computers. Taken together these items show the vast and important role that women have played in effecting social, political, and scientific change through different forms of cartography.
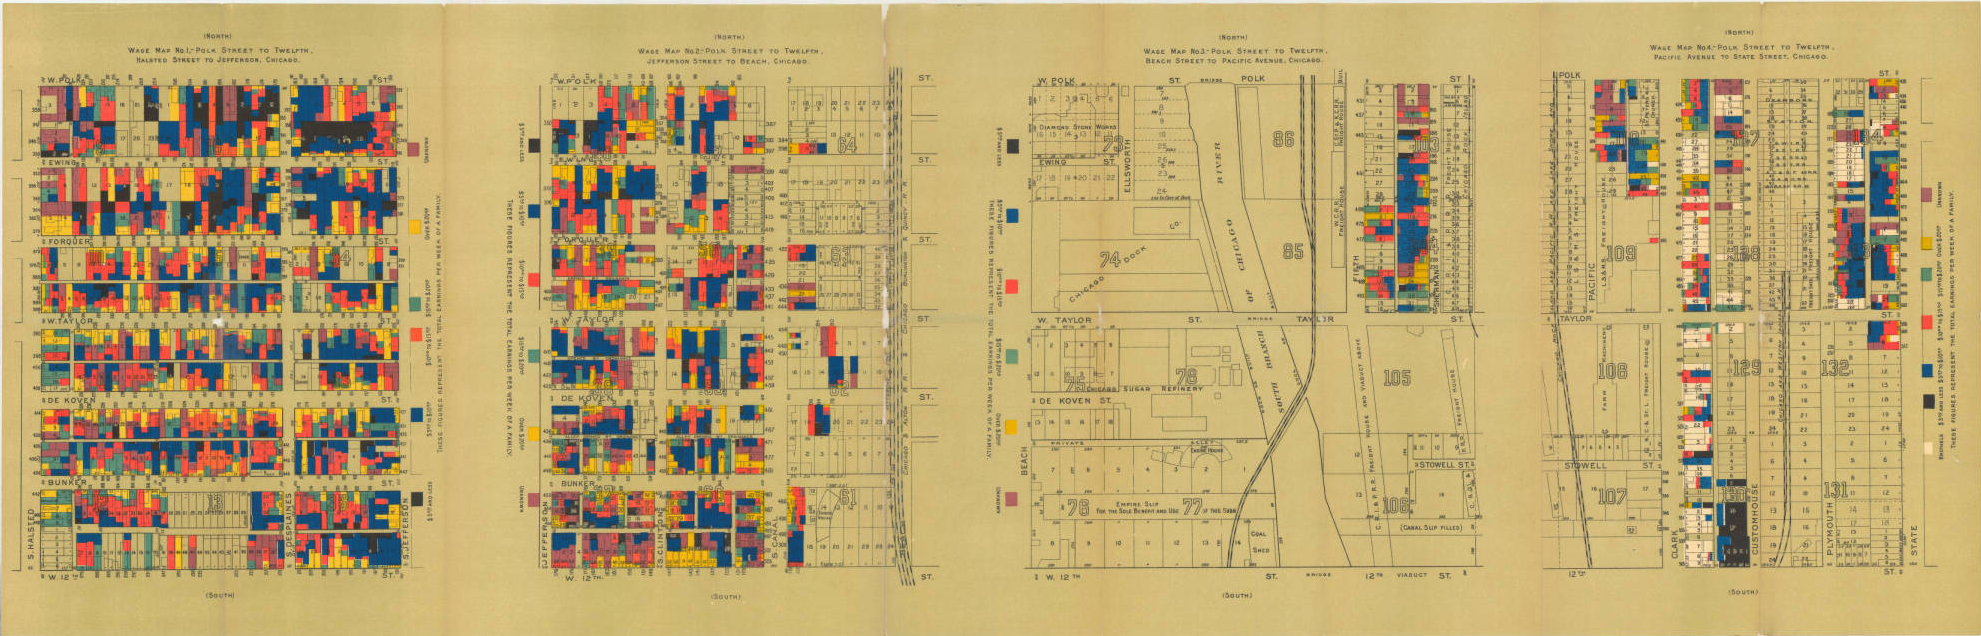
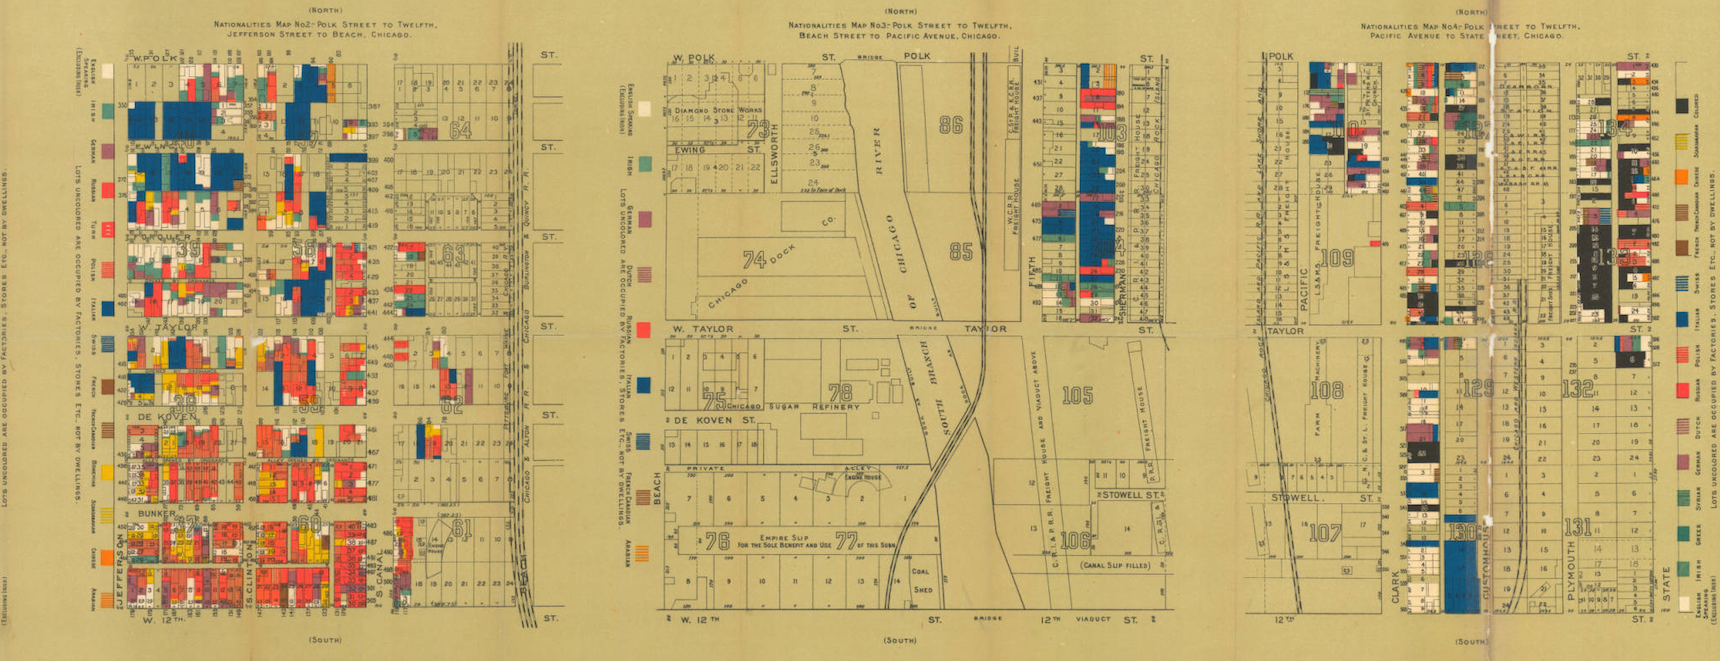
The Hull House (founded in 1889) set a foundation for social work in the United States through the investigative efforts demonstrated by the Hull House Maps & Papers. Holbrook states, "merely to state symptoms and go no farther would be idle; but to state symptoms in order to ascertain the nature of disease, and apply, it may be, its cure, is not only scientific, but in the highest sense humanitarian." The HHM&P were a constructive effort to address systemic problems such as income inequality and unjust labor conditions rampant under laissez faire economics. Agnes Holbrook's detailed thematic maps use color and statistics to present social facts about immigrant population and the wage distribution of slum sections of Chicago immediately East of the house. Very modern in design, the statistical data were placed on base maps provided by Chicago surveyor Samuel Greeley. The maps are heavily influenced by earlier statistical maps by Charles Booth, in his Life and Labour of the People in London (1889); Booth had used thematic maps to graphically illustrate income inequalities and the spread of disease.
Agnes Sinclair Holbrook
Wage maps
In: Hull-House Maps and Papers presentation of nationalities and wages in a congested district of Chicago together with comments and essays on problems growing out of the social conditions by residents of Hull-House, a social settlement at 335 South Halsted Street, Chicago, Ill. (Chicago, 1895)
University of Maine Orono Collections
Agnes Sinclair Holbrook
Nationalities maps
In: Hull-House Maps and Papers presentation of nationalities and wages in a congested district of Chicago together with comments and essays on problems growing out of the social conditions by residents of Hull-House, a social settlement at 335 South Halsted Street, Chicago, Ill. (Chicago, 1895)
University of Maine Orono Collections
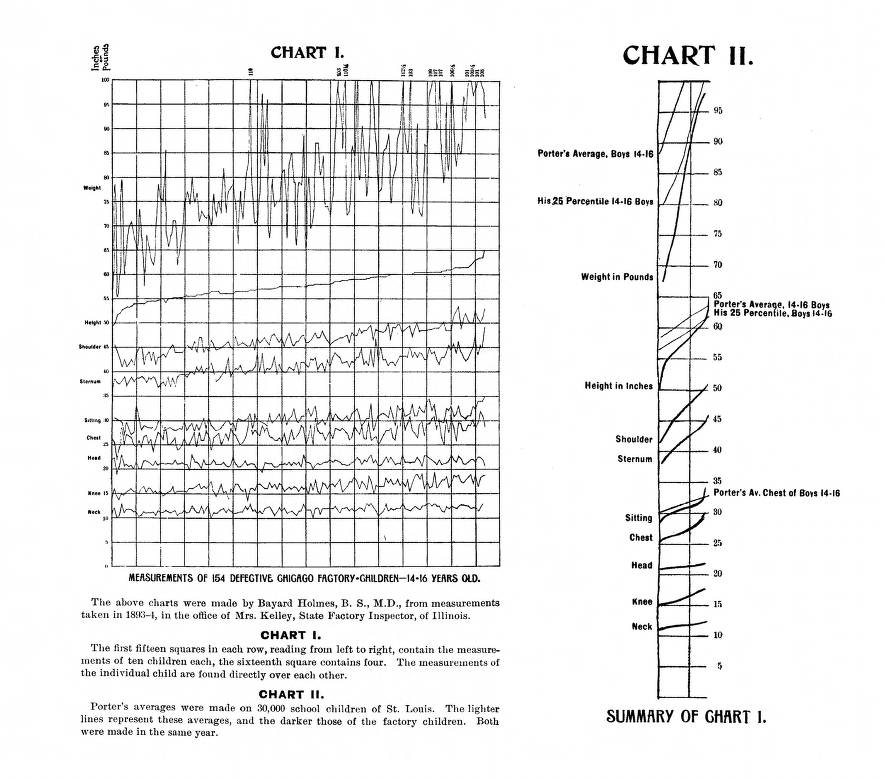
An investigation into the conditions of child labor was of great concern for Florence Kelley, Chief Factory Inspector for the state of Illinois and resident of Hull House. These charts compare the physical development of child factory workers to that of their peers as evidence of the harm that factory work had on children. Kelley struggled for reform that would get the children out of the sweatshops and factories and into the schools. Her investigations and advocacy would come to influence the passage of child labor laws in the United States.
Agnes Sinclair Holbrook
"Measurements of 154 Defective Chicago Factory-Children, 14-16 Years Old"
In: Hull-House Maps and Papers presentation of nationalities and wages in a congested district of Chicago together with comments and essays on problems growing out of the social conditions by residents of Hull-House, a social settlement at 335 South Halsted Street, Chicago, Ill. (Chicago, 1895)
University of Maine Orono Collections
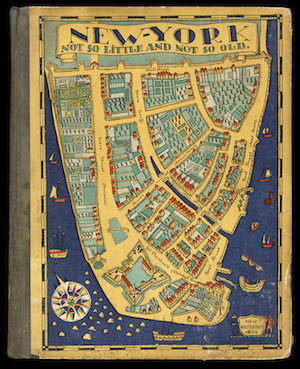
Ilonka Karasz
Decorative cover to: Sarah M. Lockwood, New York, Not So Little and Not So Old (New York: Doubleday, Page, & Co., 1926)
Color lithograph, 26 x 20 cm
OML Collections
Paula Scher's cartographic humor artistically plays with familiar geography, and presents it beautifully and uniquely. This world trade map highlights the various air and shipping lines, major trade routes the world with all those possible connections literally weaving across the earth.
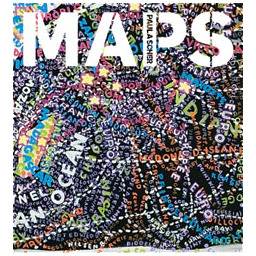
Paula Scher
World Trade Map
In: Maps: Paintings, Installations, Drawings and Prints (New York: Princeton Architectural Press, 2012)
Color lithograph, 29 x 54 cm
OML Ref. Collections
Toy Lasker conceived and designed this work in 1967, and partnered with New York Magazine to produce this map index to Manhattan art galleries and museums, restaurants, parks, theaters, transportation, and other entertainment opportunities for residents, tourists, and business people.

Toy Lasker
Avenues and Maine Cross Streets and Crosstown Buses
In: Flashmaps, Instant Guide to New York (New York, 1986)
Color lithograph, 28 x 10 cm
Auletta Collection
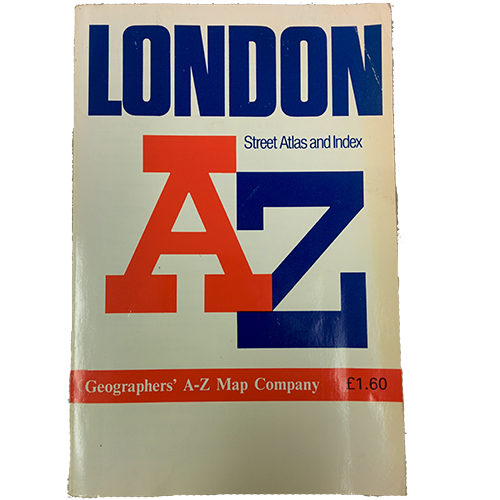
Phyllis Pearsall
Westminister
In: London A-Z street atlas and index
16 x 19 cm
OML collection
Ruth Taylor was a prominent commercial producer of pictorial maps, which she called "cartographs," from the 1920s through the mid-1940s. Our U.S.A. was her largest project. Her maps used a consistent aesthetic to depict cultural geography as can been seen in this map of Colorado.

Ruth Taylor [White]
Colorado
In: Frank J. Taylor and Ruth Taylor, Our U.S.A. A Gay Geography (Boston: Little, Brown, & Co., 1935), 19.
Color lithograph, 22 x 28 cm
Gibb Collection
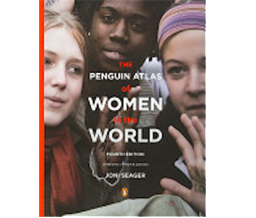
This outstanding atlas won the American Association of Geographers' Media Achievement Award, and has been published in French, German, Japanese and Spanish. Professor Seager is a feminist geographer and professor at Bentley University in Waltham, Massachusetts.
Barbara Petchenik
Population
In: Lester J. Cappon, ed., Atlas of Early American History: The Revolutionary Era, 1760–1790 (Princeton, N.J.: Princeton University Press for the Newberry Library and the Institute of Early American History and Culture, 1976), 66–67.
40 x 29 cm
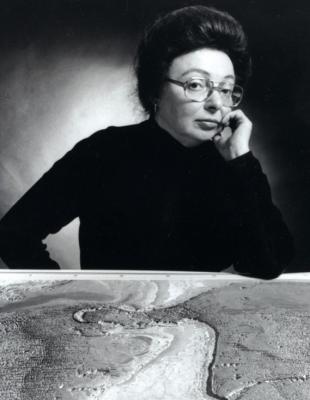
Photo of Marie Tharp by Steve Sagala
Courtesy of Lamont-Doherty Earth Observatory, Columbia University
As the first physiographic map to illustrate the complexities of the Mid-Ocean Ridge it fostered a revolution in geological thought, by revealing a hidden frontier of the ocean. As Marie drafted this underwater seascape she identified a rift valley along the crest of the Ridge. The rift extended out far beyond the North Atlantic (40,000 miles), across the earth in a continuous chain. It was not the presence of the rift valley alone that would 'shake the foundations of geology' but rather, the pattern exposed inside the rift of earthquake epicenters. The correlation of the two (the rift and seismic activity) brought the once rejected continental drift theory back into discussion and helped shape what we know today as the more comprehensive theory of plate tectonics.
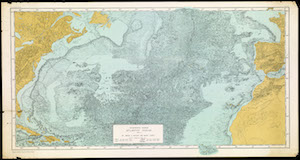
Marie Tharp and Bruce Heezan
Physiographic Diagram, Atlantic Ocean (Sheet 1) (New York, 1957)
Color lithograph, 75 x 141 cm
Neikirk collection
The mapping of the Indian Ocean was part of a larger effort by the International Indian Ocean Expedition (IIOE) and sponsored by UNESCO, to increase international scientific relations as well as to discover the unknown seafloor in this region. Marie produced this map from sounding data she received from forty-five representatives from seven countries, while Bruce (Heezen) would later communicate their findings. Partners in oceanographic research and publications, Heezen was credited solely for their work for years, and only recently has Marie gained rightful credit for her extraordinary cartography.
These early editions of the Heezen-Tharp maps of the ocean floors have an informal, almost sketch-like style, with iconic representations of particular features in the depths. Numbers all over the map tell us the depth of the ocean floor, and elevations of individual undersea mountains.
Later versions of the ocean floor maps were more sophisticated physical maps using color and shading to show the dramatic mid-ocean canyons that revealed the divisions between the earth's continental plates.
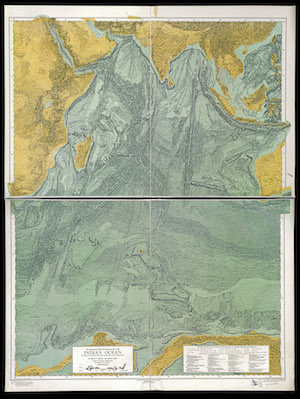
Marie Tharp and Bruce Heezan
Physiographic Diagram of the Indian Ocean, the Red Sea, the South China Sea, the Sulu Sea and the Celebes Sea (New York: Geological Society of America, 1964)
148 x 119 cm
OML Collections

Anne Potenzo Mountford
Approaches to Io-Jima (Sulphur Island) (Washington D.C., 1944)
35 x 48 cm
OML Collections

Photo of Anne Potenzo Mountford
c.1945
Emily Garfield
Growing Fields (Cityspace #100)
Digital print 27 x 35 cm
OML collection